The prime minister has pledged to tackle the “bulging benefits bill blighting our society”, as the government continues looking for ways to slash its spending.
In 2024 to 2025, the UK is forecast to spend £319.1 billion on the social security system — a figure the Labour government is determined to cut.
Here’s what we know about what payments make up the benefits bill, what is the largest expense, and how the UK’s welfare spend compares to other countries.
What do we spend most money on?
According to official statistics, the state pension is the largest single item of welfare spending. Around 55% of social security expenditure goes to pensioners.
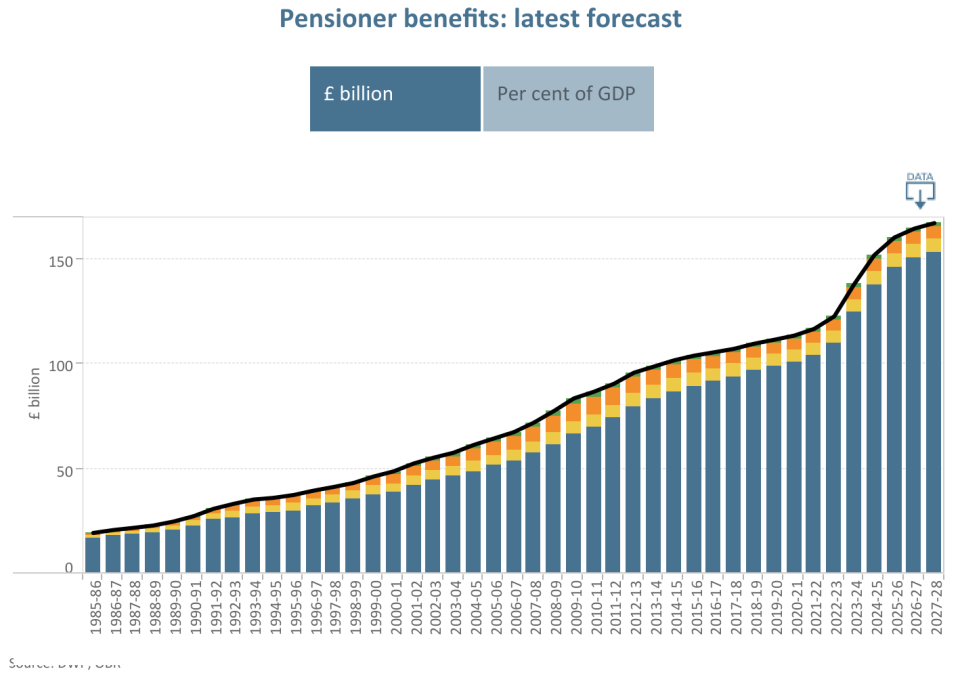
The Office for Budget Responsibility — a non-governmental body founded by the Treasury to provide independent economic forecasts and analysis of the public finances — found that pensioner benefits made up 42% of the welfare spend total in 2023-24.
In 2023-2024, the bill for state pensions was £125 bn, accounting for over a third of the welfare spend. In 2024-2025, that figure is projected to rise to £138bn.
This is partly due to the triple lock, which means that state pensions increase by inflation, average earnings, or 2.5%, whichever is higher.
Pensioner housing benefit, pension credit and winter fuel payments make up the rest of this figure, with the slim green block in the table above representing winter fuel payment, accounting for £2bn of the spend.
Comparatively, universal credit and legacy benefits like jobseeker’s allowance made up 27% of total welfare spending in the last year. This makes the bill slightly lower than its 28% share in 2022-23.
It appears the government is focusing on these areas because this bill is anticipated to grow.
Universal credit and legacy spending was around £80.9bn in 2023-24, up from £73.4bn in 2022-23.
But this isn’t exclusive to universal credit. The state pension spend is also expected to rise to £138bn in the year ahead.
Disability benefits have also been under intense scrutiny under the current government.
They made up 12.2% of total welfare spending in 2023-24, up from 11.5% the year before.
Child benefit makes up the smallest total, accounting for 4.2% of total welfare spending in 2023-24.
What country spends the most on its benefits bill?
While some people in the UK believe that the country’s welfare system is the most generous in the world, this is not quite accurate.
According to the UK’s own findings, the country ranks 17th for its welfare spend compared to its GDP (the value of the goods and services provided in the country).
France and Italy have the highest level of public social expenditure, which was over 30% of GDP in 2022.
Across the board, countries have spent more following the fallout of COVID-19.
In fact, the OBR places the UK’s spending on several benefits, such as incapacity-related benefits, as “slightly below” the OECD average — which represents 38 different countries across the world.
This makes up 1.3% of the GDP, compared to 1.6%.
Social protection — a wide-ranging area of spending, covering areas like housing benefit, pensions, and supporting people who are at risk of exclusion from society — is the highest category of government spending, accounted for £361 billion in the last year.
For context, the government spent £221 billion of total spending on health, and £112 billion of total spending on education.
The UK is not an outlier with these figures. In fact, pretty much every country in the EU and the OECD spends more on its social protection bill than anything else.
What about spending on fraud?
One of the government’s areas of focus is cracking down on any bogus benefit payments made to fraudsters.
Starmer used a Mail On Sunday op-ed to promise a crackdown on “criminals” who “game the system”.
He wrote: “In the coming months, Mail On Sunday readers will see even more sweeping changes. Because make no mistake, we will get to grips with the bulging benefits bill blighting our society.
“Don’t get me wrong, we will crack down hard on anyone who tries to game the system, to tackle fraud, so we can take cash straight from the banks of fraudsters.
“There will be a zero-tolerance approach to these criminals.”
But the DWP’s figures show that this is more prevalent in some benefits than others.
The rate of fraud relating to personal independence payments (PIP) — a payment to help disabled people with extra costs — is so small that it was assessed at 0% in the government’s annual report released earlier this year.
Universal credit was found to have the highest level of fraud, standing at 10.9%, while fraud in pension credit and housing benefit stood at 3.9%
Those in receipt of universal credit were the most likely to receive an overpayment, accounting for 12.9%.
And while overpayments can be caused by government error, or the error a claimant has made, every overpayment — whether it is the government or individual’s fault — has to be paid back.
EMEA Tribune is not involved in this news article, it is taken from our partners and or from the News Agencies. Copyright and Credit go to the News Agencies, email news@emeatribune.com Follow our WhatsApp verified Channel


