By now, most people have seen the headlines that scores on the National Assessment of Educational Progress are continuing to nosedive.
Many stories also picked up on the fact that achievement gaps are growing, as lower-performing students have fallen further behind. For instance, in eighth grade math, the scores for the top 10% of students rose 3 points, while the bottom 10% fell 5 points.
But these national numbers are hiding the fact that achievement gaps are growing in all 50 states and the District of Columbia. While they vary in magnitude, the extent of the divergence playing out in schools across the country is alarming.
Advertisement
Advertisement
Before going into those state-level results, it’s important to acknowledge that this is a uniquely American problem. The separation between the higher- and lower-performing students in the United States has grown faster than anywhere else in the world over the last decade, and there’s no signs yet of that slowing down.
New NAEP Scores Dash Hope of Post-COVID Learning Recovery
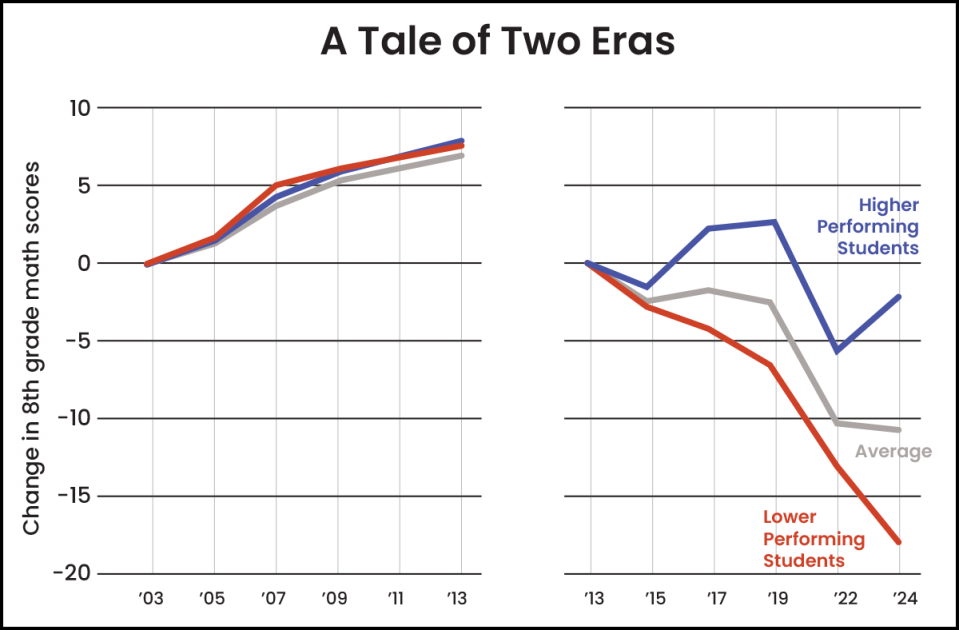
Last spring, I did an analysis that showed that before 2013, achievement scores were rising, and those gains were broadly shared across student performance levels.
Consider the left side of the graph below, which shows the NAEP results in eighth grade math, updated through 2024. It is clear that something happened around 2013: On average, scores fell a little bit, but lower-performing students (in red) fell off a cliff.
Advertisement
Advertisement
Meanwhile, the scores of higher-performing students (in blue) suffered a bit in the wake of COVID-19, but they improved noticeably last year, while the lowest performers did not.

Source: National Center for Education Statistics, National Assessment of Student Progress (NAEP)
A similar pattern shows up across a wide range of national and international tests, grade levels and subject areas.
It is also evident in state after state. After the latest results came out, I looked to see how these gaps were changing at the state level. I looked specifically at eighth grade math, and the numbers were shockingly bad. In fact, in every state, the achievement gap has grown over the last two years.
Interactive: See How Student Achievement Gaps Are Growing in Your State
But those short-term changes don’t explain the full extent of what has happened to American children over the last decade. Each state has seen its achievement gap increase significantly.
Advertisement
Advertisement
More in U.S.
To see the full state-level results, check out the table below, which shows the changes from 2013 to 2024. It breaks down the gains (or losses) for students at the 90th percentile, the midpoint of all students in the state (the median) and the bottom 10th percentile. It also shows how much these groups have diverged over time and the gap that has grown.
And those gaps have increased in every state, most dramatically in Massachusetts, California, Texas, Arizona, Washington, Rhode Island, New Jersey and Pennsylvania. In all of these, the gap widened by 20 points or more.
How meaningful are these changes? Depending on the year, the average student gains about 10 points per year on the NAEP math tests. As a rough comparison, that means achievement gaps have grown by the equivalent of one to two years’ worth of schooling. That’s substantial.
These gaps may seem daunting, and policymakers might be tempted to throw up their hands. But they should take heart from the fact that this recent period of academic stagnation is unusual. Until about a decade ago, small but steady gains were the norm. When researchers M. Danish Shakeel of the University of Buckingham and Paul Peterson from Harvard University looked at this question a few years ago, they concluded that, “average student achievement has been increasing for half a century. Across 7 million tests taken by U.S. students born between 1954 and 2007, math scores have grown by 95% of a standard deviation, or nearly four years’ worth of learning.” They found smaller but still positive results for reading and a narrowing of gaps across racial, ethnic and socioeconomic status.
In other words, progress is possible. At the moment, American achievement scores are falling and gaps are growing, but it wasn’t that long ago when the data were going in a much more positive direction.
EMEA Tribune is not involved in this news article, it is taken from our partners and or from the News Agencies. Copyright and Credit go to the News Agencies, email news@emeatribune.com Follow our WhatsApp verified Channel


