

Key Takeaways
Broadcom shares fell nearly 4% on Monday, joining a sell-off in other leading chipmakers, as investors booked profits in some of this year’s best performing stocks that have ridden Wall Street’s AI wave.
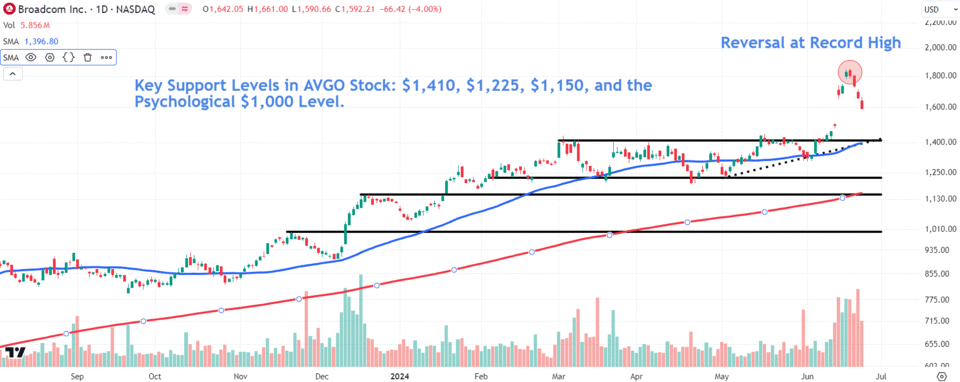
Momentum appeared to shift in Broadcom shares last Tuesday after the stock climbed to a new record high but staged an intraday reversal to close lower for the day. Since then, the stock has formed three consecutive red bars on above-average volume, indicating selling conviction.
Key retracement levels to watch in Broadcom shares include: $1,410, $1,225, $1,150, and the psychological $1,000 level.
For further clues that buyers could be moving back into the stock, investors should watch for bullish price patterns, such as a hammer candlestick of a piercing pattern, at these price levels.
Broadcom (AVGO) shares fell nearly 4% on Monday, joining a sell-off in other leading chipmakers, as investors booked profits in some of this year’s best performing stocks that have ridden Wall Street’s artificial intelligence (AI) wave amid insatiable enterprise demand for hardware that powers the technology.
Below, we take a closer look at the Broadcom chart and identify four key levels to watch out for amid further weakness in the chipmaker’s share price.
Reversal From Record High Shifts Momentum
Broadcom shares broke above an ascending triangle earlier this month, with the price initially moving sharply higher, driven by the chipmaker’s second quarter revenue beat and the announcement of a 10-for-1 stock split.
However, momentum appeared to shift last Tuesday after the stock climbed to a new record high but staged an intraday reversal to close lower for the day. Since then, the stock has formed three consecutive red bars on above-average volume, indicating conviction behind the selling from larger market participants.
Key Retracement Levels to Watch
Firstly, it’s worth keeping an eye on the $1,410 level, an area that may find buying interest from the 50-day moving average (MA) and a horizontal line connecting several price peaks over the past four months.
Secondly, the shares may encounter support around $1,225, an area on the chart near a trendline linking a series of price action between February and May.
A steeper decline could see the stock revisit the $1,150 level where the price would likely attract buyers near the prominent December 2023 swing high that currently aligns with the rising 200-day MA.
Finally, a significantly deeper retracement may see the shares fall to the psychological $1,000 level, currently 37% below Monday’s closing price of $1,592.21. This area also finds support from the November 2023 swing high.
For further clues that buyers could be moving back into the stock, investors should watch for bullish price patterns, such as a hammer candlestick of a piercing pattern, at these key price levels.
Broadcom shares fell 3.7% on Monday and have lost 14% of their value since hitting their all-time intraday high last Tuesday.
The comments, opinions, and analyses expressed on Investopedia are for informational purposes only. Read our warranty and liability disclaimer for more info.
As of the date this article was written, the author does not own any of the above securities.
Read the original article on Investopedia.
EMEA Tribune is not involved in this news article, it is taken from our partners and or from the News Agencies. Copyright and Credit go to the News Agencies, email news@emeatribune.com Follow our WhatsApp verified Channel