


Investment advisers always tell their clients that it is best to have diversified portfolios. But a typical index fund is highly concentrated in a small number of companies, because most stock indexes are weighted by market capitalization. This has worked out well over the past 10 years as shares of tech-oriented giants have soared, but sometimes dividend-paying stocks outperform.
Ben Kirby is the co-head of investments at Thornburg Investment Management, which oversees about $44 billion in client accounts and mutual funds. During an interview with MarketWatch, he said that dividend-paying stocks had become especially attractive relative to growth stocks. He provided this chart to illustrate the point:
Most Read from MarketWatch
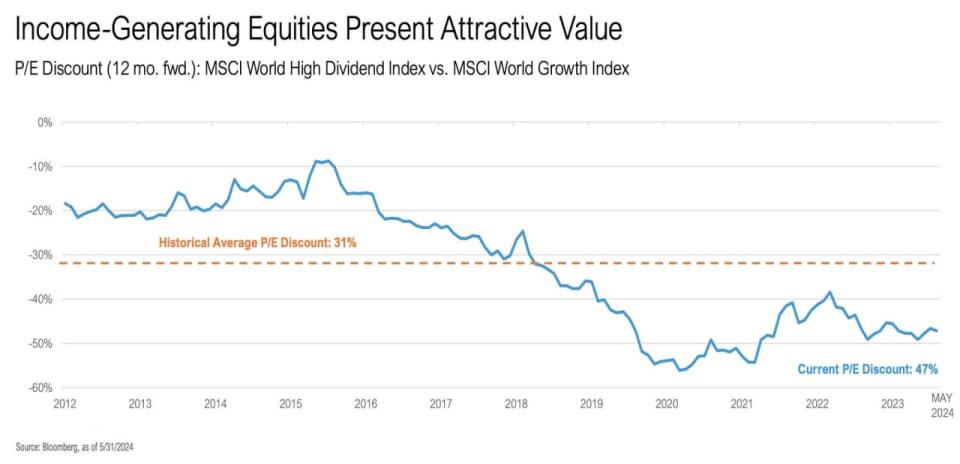
This chart compares weighted forward price-to-earnings valuations of the MSCI World High Dividend Yield Index and the MSCI World Growth Index. Both indexes are subsets of the MSCI World Index, which includes large and midcap stocks in 23 developed economies. You can read about MSCI’s methodology for the World High Dividend Yield Index here and for the World Growth Index here.
Kirby said that “the dividend yield index is usually at a discount of 25% to 30% to the growth index.” He called the 47% discount at the end of May “shocking.”
This deep discount for the MSCI World High Dividend Yield Index relative to the MSCI World Growth Index reflects their performance — the former has returned 116% over the past 10 years, while the latter has soared 256% during the same period, according to FactSet.
But the growth focus doesn’t always work this well. For the previous 10-year period through June 11, 2014, the MSCI World High Dividend Yield Index returned 117%, while the MSCI World Growth Index returned 98%.
A global approach to income and growth
Kirby co-manages the $13.1 billion Thornburg Investment Income Builder Fund TIBIX, designed to grow its dividend payouts over the long term, while also providing capital growth. Here is how it was allocated by asset class as of April 30:
Asset class | % of portfolio |
Non-U.S. stocks | 58.9% |
U.S. stocks | 26.0% |
Bonds issued in the U.S. | 8.7% |
Bonds issued outside the U.S. | 2.7% |
Cash and cash equivalents | 3.7% |
Source: Thornburg | |
For the typical U.S. investor, this fund is truly diversified, not only by asset class but by region. And Kirby pointed out that none of the “Magnificent Seven” stocks are held in the portfolio. These are the companies that have factored so heavily in the S&P 500’s SPX stellar returns over recent years. They include Microsoft Corp. MSFT, Apple Inc. AAPL, Nvidia Corp. NVDA, Amazon.com Inc. AMZN, Meta Platforms Inc. META, Alphabet Inc. GOOGL GOOG and Tesla Inc. Together these companies make up 31.9% of the SPDR S&P 500 ETF Trust’s SPY portfolio.
That is a lot of concentration in only seven companies, and the potential concentration risk has been illustrated by Tesla, which has fallen 31.3% so far this year, even as the S&P 500 has returned 13.4%.
The Thornburg Investment Income Builder Fund quotes a 30-day yield of 3.49%. It distributes dividends quarterly, and while it may be typical to reinvest the dividends, a long-term shareholder might find it convenient eventually to begin taking the income. Kirby said the fund’s dividend had grown at a compound annual growth rate (CAGR) of about 4% over the past 20 years.
One obvious question for the manager of a fund seeking to increase investors’ income is why it holds bonds at all, since fixed payments don’t increase.
Kirby said that the fund’s bond portfolio, about evenly split between investment-grade bonds and high-yield bonds, had a yield-to-worst of about 8%. (Yield-to-worst factors-in the premium or discount to a bond’s face value when it is purchased, and its maturity date or call date.)
In addition to enhancing the fund’s current dividend yield, a fluid bond allocation strategy enables the fund to take advantage of special situations, such as the tremendous decline in market values for bonds during the 2008/2009 credit crisis. During that period, Kirby and his colleagues increased the fund’s bond allocation up to 45%. The current allocation to bonds is 11.4%. The 3.7% allocation to cash is higher than usual, to take advantage of the current environment of high short-term interest rates, he said.
Top equity holdings
Kirby said that the fund’s annual turnover has typically been 25% to 30%, which would imply a four-year holding period for investments on average. But he would like to hold a stock much longer if a company’s financial performance is solid, if it is expected to continue increasing its dividend and if its valuation to expected earnings isn’t too high.
The fund doesn’t only focus on companies with stellar track records for dividend increases. Its managers will also invest in stocks that appear to have good values, with expected cash flow to cover rising dividends. They might do this even if a company’s recent history hasn’t been so good. A look at the fund’s top 10 U.S. stockholdings provides examples of both. There is too much relevant data to fit into one table, so here are two, followed by explanations of the data and Kirby’s comments on two of the companies:
Company | Ticker | % of Thornburg Investment Income Builder Fund as of April 30 | Current dividend yield | Dividend yield 5 years ago | Dividend yield on shares purchased 5 years ago |
Broadcom Inc. | AVGO | 3.8% | 1.44% | 3.74% | 7.41% |
Citigroup Inc. | C | 2.9% | 3.58% | 2.65% | 3.12% |
AT&T Inc. | T | 2.7% | 6.22% | 8.41% | 4.58% |
CME Group Inc. Class A | CME | 2.0% | 2.32% | 1.51% | 2.31% |
Merck & Co. Inc. | MRK | 1.9% | 2.34% | 2.78% | 3.89% |
JPMorgan Chase & Co. | JPM | 1.6% | 2.37% | 2.89% | 4.16% |
Equitable Holdings Inc. | EQH | 1.5% | 2.37% | 2.81% | 4.50% |
Pfizer Inc. | PFE | 1.5% | 5.99% | 3.56% | 4.16% |
LyondellBasell Industries NV | LYB | 1.5% | 5.56% | 4.97% | 6.34% |
Home Depot Inc. | HD | 1.3% | 2.68% | 2.75% | 4.55% |
Sources: Thornburg, FactSet | |||||
Company | Ticker | five-year Dividend change | Five-year dividend CAGR | 5-year price change | 5-year total return |
Broadcom Inc. | AVGO | 98% | 14.7% | 415% | 506% |
Citigroup Inc. | C | 18% | 3.3% | -13% | 5% |
AT&T Inc. | T | -46% | -11.5% | -26% | 2% |
CME Group Inc. Class A | CME | 53% | 8.9% | 0% | 21% |
Merck & Co. Inc. | MRK | 40% | 7.0% | 67% | 94% |
JPMorgan Chase & Co. | JPM | 44% | 7.5% | 76% | 104% |
Equitable Holdings Inc. | EQH | 60% | 9.9% | 90% | 117% |
Pfizer Inc. | PFE | 17% | 3.1% | -31% | -15% |
LyondellBasell Industries NV | LYB | 28% | 5.0% | 14% | 54% |
Home Depot Inc. | HD | 65% | 10.6% | 70% | 91% |
Source: FactSet | |||||
The first table shows current dividend yields, which in many cases aren’t very high. They may also be lower than the yields were five years ago. But Broadcom Inc. AVGO, the fund’s largest holding, provides an example of how rewarding it can be to remain committed to a company that steadily raises its dividend payout.
If you had purchased shares of Broadcom on June 11, 2019, you would have paid $283.48 a share and the annual dividend at that time was $10.60 a share, making for a then-current yield of 3.74%. As of Tuesday’s close, the share price had risen 415% to $1,461.03. The annual dividend payout had nearly doubled to $21. So an investor buying shares at Tuesday’s close would be looking at a dividend yield of only 1.44%. But your yield on your five-year-old shares, based on what you paid for them, would be 7.41%.
Broadcom is an extreme example because it has provided so much growth while doubling the dividend Kirby said he had been holding it in the fund for seven or eight years. ”We still think Broadcom has a lot of potential,” he said, because of its high level of participation in the artificial-intelligence build-out relative to most competitors in the semiconductor space.
Home Depot Inc. HD — the fund’s 10th largest U.S. stockholding — is another interesting example. If you bought the stock five years ago, your dividend yield initially was 2.75%. It would have risen to 4.55% for your five-year-old shares while the stock price had gone up 70%. Home Depot’s five-year total return with dividends reinvested has been 91%, which has trailed the S&P 500’s return of 102%.
On the other side of the spectrum is AT&T Inc. T, which is a newer holding for the fund. AT&T cut its dividend in 2022 as part of its complicated deal to divest former Time Warner assets when Warner Bros. Discovery Inc. WBD was formed. In retrospect, AT&T has hurt shareholder value by overpaying for those assets and for DirecTV, which it acquired in 2015.
Based on the current yield of 6.22%, a high level of free cash flow and his expectation that AT&T’s leadership will follow “a more sensible strategic approach,” Kirby believes this stock can be “a low-teens total-return compounder for the next two to three years.”
Fund performance
The Thornburg Investment Income Builder Fund is rated five stars (the highest rating) within Morningstar’s Global Allocation/Large Value fund category. Here’s how it has performed over several periods through June 11:
1-year return | 3-year average return | 5-year average return | 10-year average return | 15-year average return | |
Thornburg Investment Income Builder Fund – Class I | 17.37% | 7.05% | 8.65% | 6.37% | 8.85% |
Morningstar Global Allocation – Large Value category | 11.01% | 0.87% | 5.28% | 4.05% | 6.60% |
Morningstar Global Allocation Index (U.S. dollars) | 12.94% | 0.85% | 6.09% | 5.40% | 7.23% |
Fund percentile ranking within category | 7 | 1 | 5 | 7 | 5 |
Source: Morningstar | |||||
Kirby said that since the fund’s Class I shares were made available late in 2003, the annualized return for this share class has been about 9.2%, with about half of the return coming from dividend payments and the other half from capital appreciation.
“There is a structural long-term argument for investing in dividend strategies,” he said, acknowledging that the outperformance of growth stocks has made for ”a near-term argument the other way.”
Don’t miss: These restaurant companies are expected to show the fastest growth through 2026
Most Read from MarketWatch
EMEA Tribune is not involved in this news article, it is taken from our partners and or from the News Agencies. Copyright and Credit go to the News Agencies, email news@emeatribune.com Follow our WhatsApp verified Channel