

Over the long run, Wall Street has proven to be a bona fide wealth creator. Although other asset classes, such as bonds and housing, have made investors richer, nothing else comes remotely close to the average annual return that stocks have delivered for more than a century.
Right now, Wall Street is enjoying yet another rip-roaring bull market. Since the green flag waved at the start of 2023, the ageless Dow Jones Industrial Average (DJINDICES: ^DJI), benchmark S&P 500 (SNPINDEX: ^GSPC), and growth-fueled Nasdaq Composite (NASDAQINDEX: ^IXIC) have respectively increased by 18%, 43%, and 71%, as of the closing bell on June 27, 2024.

But if there’s one given on Wall Street, it’s that stocks don’t move up in a straight line. While artificial intelligence (AI) and stock-split euphoria are fueling the current bull market, three predictive indicators with historically strong correlations to downside on Wall Street appear to foreshadow a potential stock market crash in 2024.
A historic decline in U.S. M2 money supply
To be clear, no metric can, with guaranteed accuracy, forecast a short-term directional move for the major stock indexes. However, select indicators have historically had a knack for predicting downside in the Dow Jones, S&P 500, and Nasdaq Composite. U.S. M2 money supply is one such metric.
M2 money supply comprises everything you’d find in M1 — cash and coins in circulation, as well as demand deposits in a checking account — and adds in money market accounts, savings accounts, and certificates of deposit (CDs) below $100,000. Think of M1 as money that can be spent on the spot and M2 as money that can still be spent somewhat easily but requires more work to get to.
For nine decades, M2 money supply has been expanding with virtually no interruption. In other words, more capital has been needed in circulation to support a growing economy.
WARNING: the Money Supply is officially contracting. 📉
This has only happened 4 previous times in last 150 years.
Each time a Depression with double-digit unemployment rates followed. 😬 pic.twitter.com/j3FE532oac
— Nick Gerli (@nickgerli1) March 8, 2023
But since peaking in April 2022, M2 has meaningfully fallen off. Although it’s up 0.69% on a year-over-year basis, U.S. M2 money supply has declined by 3.49% on an aggregate basis since its all-time high. As you can see in the post on X from Reventure Consulting CEO Nick Gerli, this marks only the fifth time since 1870 (when back-tested) that M2 has moved lower by at least 2% on a year-over-year basis (1878, 1893, 1921, 1931-1933, and 2023).
The four previous instances where M2 fell by at least 2% correlated with periods of double-digit unemployment and economic depressions. While two of these instances occurred prior to the creation of the Federal Reserve, and the likelihood of a depression is very low today, the takeaway is that less capital in circulation leads to fewer discretionary purchases by consumers. In short, it’s a recipe for a recession — and the stock market historically performs poorly once a recession has been declared.
The longest yield-curve inversion of the modern era
The second predictive tool that appears to portend trouble for Wall Street is the Treasury yield curve. Compared to the M2 money supply, this is a much more popular metric.
Normally, the Treasury yield curve slopes up and to the right. This is to say that longer-dated Treasury bonds (those maturing in 10 or 30 years) sport higher yields than Treasury bills set to mature in a year or less. The longer your money is tied up in an interest-bearing asset, the higher the yield should be.
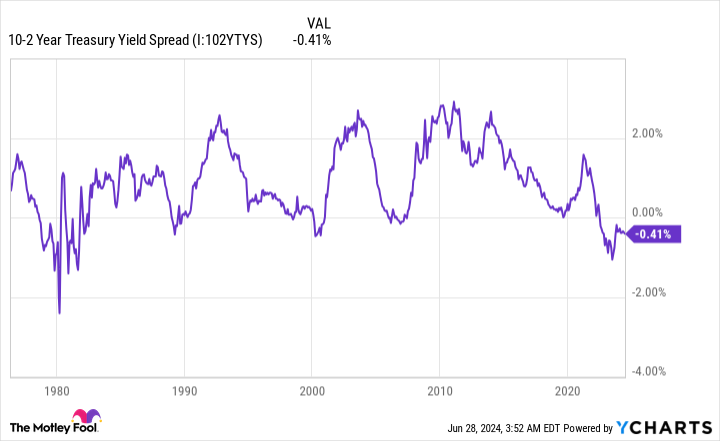
Since July 5, 2022, the spread (difference in yield) between the 10-year bond and the two-year Treasury bill has been underwater. In other words, Treasury securities maturing in two years have had a higher yield than the 10-year Treasury bond. This is what’s known as a yield-curve inversion, and it’s the longest one of the modern era.
Here’s the interesting thing about yield-curve inversions: They’ve preceded every single U.S. recession since the end of World War II. Approximately two-thirds of the S&P 500’s peak-to-trough drawdowns have occurred during U.S. recessions.
However, and this is a big “however,” not every yield-curve inversion has been followed by a recession. Think of a yield-curve inversion as a necessary ingredient that signals the U.S. economy is facing headwinds.
Stocks are exceptionally pricey
The third predictive metric that suggests a potential stock market crash may be forthcoming is the valuation-based Shiller price-to-earnings (P/E) ratio, also commonly referred to as the cyclically adjusted price-to-earnings (CAPE) ratio.
Whereas the traditional P/E ratio focuses on trailing-12-month earnings, the S&P 500’s Shiller P/E is based on average inflation-adjusted earnings over the prior 10 years. Examining 10 years’ worth of earnings history smooths out the “hiccups” (e.g., the effects of COVID-19) that might otherwise skew investors’ perceptions of value.
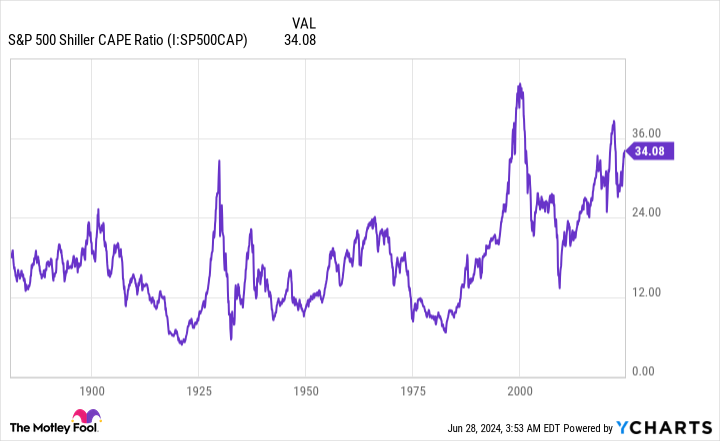
As of the closing bell on June 27, the S&P 500’s Shiller P/E stood at 35.70. For some context, this is more than double its 17.13 average when back-tested over the last 153 years.
What’s of interest with the Shiller P/E is examining how Wall Street’s major stock indexes have responded when it’s surpassed 30 during a bull market. Since 1871, this has occurred six times: 1) August 1929-September 1929, 2) June 1997-August 2001, 3) September 2017-November 2018, 4) December 2019-February 2020, 5) August 2020-May 2022, and 6) November 2023-current.
The five prior instances of the Shiller P/E ratio topping 30 eventually resulted in the Dow Jones Industrial Average, S&P 500, and/or Nasdaq Composite shedding between 20% and 89% of their value.
As you can see by the dates of these six instances, there’s no rhyme or reason for how long stocks can remain pricey. What is clear is that extended valuations aren’t sustained over the long run. When the S&P 500’s Shiller P/E ratio tops 30 for any length of time, it’s historically been a cautionary tale that a bear market and/or potential crash awaits.

Time and perspective change everything
To reiterate, the three predictive metrics above suggest the ingredients exist for a potential stock market crash in 2024. What they don’t do is guarantee anything. It’s impossible to concretely forecast what stocks will do a week, a month, or even a year from now.
But when investors take a step back and widen their perspectives, it becomes a lot easier to forecast where stocks are collectively headed.
Take the economic cycle as a good example. No matter how much workers might loathe the idea of slowdowns and recessions, the fact remains that they’re perfectly normal. No amount of well-wishing can stop recessions from occurring.
However, this boom-bust cycle for the economy isn’t linear. Since World War II ended in September 1945, nine of 12 U.S. recessions were resolved in less than a year, and none of the remaining three surpassed 18 months. By comparison, most periods of economic growth stuck around for multiple years, with two expansions lasting longer than 10 years. Being an optimist and betting on the U.S. economy to expand has, without question, been a smart move.
This same dynamic plays out on Wall Street.
In June 2023, Bespoke Investment Group made the post you see above on X. It highlights the calendar length of every bear and bull market in the S&P 500 dating back to the start of the Great Depression in September 1929. What you’ll note is that the average length of bull markets (1,011 calendar days) for the S&P 500 is roughly 3.5 times longer than the typical S&P 500 bear market (286 calendar days).
To add, almost half of the S&P 500 bull markets (13 of 27) stuck around longer than the lengthiest bear market over a 94-year stretch.
An extensive data set from the investment advisors at Crestmont Research adds to the value of time and perspective. Crestmont’s analysts calculated the rolling 20-year total returns of the S&P 500, including dividends, when back-tested to 1900. This research yielded 105 rolling 20-year periods (1919-2023).
What this data set showed was that all 105 rolling 20-year periods would have produced a positive annualized total return. In plain English, if you had hypothetically purchased an S&P 500 tracking index at any point since 1900 and held that position for 20 years, you’d have made money, without fail, every single time.
No matter how scary the data or short-term predictions may appear, time and perspective haven’t let investors down.
Don’t miss this second chance at a potentially lucrative opportunity
Ever feel like you missed the boat in buying the most successful stocks? Then you’ll want to hear this.
On rare occasions, our expert team of analysts issues a “Double Down” stock recommendation for companies that they think are about to pop. If you’re worried you’ve already missed your chance to invest, now is the best time to buy before it’s too late. And the numbers speak for themselves:
Amazon: if you invested $1,000 when we doubled down in 2010, you’d have $21,765!*
Apple: if you invested $1,000 when we doubled down in 2008, you’d have $39,798!*
Netflix: if you invested $1,000 when we doubled down in 2004, you’d have $363,957!*
Right now, we’re issuing “Double Down” alerts for three incredible companies, and there may not be another chance like this anytime soon.
*Stock Advisor returns as of June 24, 2024
Sean Williams has no position in any of the stocks mentioned. The Motley Fool has no position in any of the stocks mentioned. The Motley Fool has a disclosure policy.
Stock Market Crash 2024? 3 Predictive Metrics That Suggest a Sizable Downturn in Stocks Is Forthcoming was originally published by The Motley Fool
EMEA Tribune is not involved in this news article, it is taken from our partners and or from the News Agencies. Copyright and Credit go to the News Agencies, email news@emeatribune.com Follow our WhatsApp verified Channel